
Step-by-Step Guide
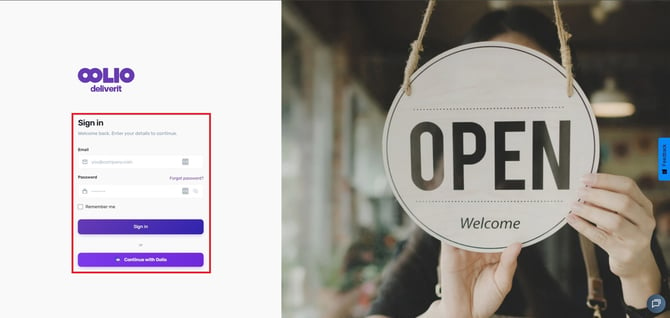
Log In to Studio
Start by logging in to your Studio account using your credentials.
Open the Reports Dashboard
Once logged in:
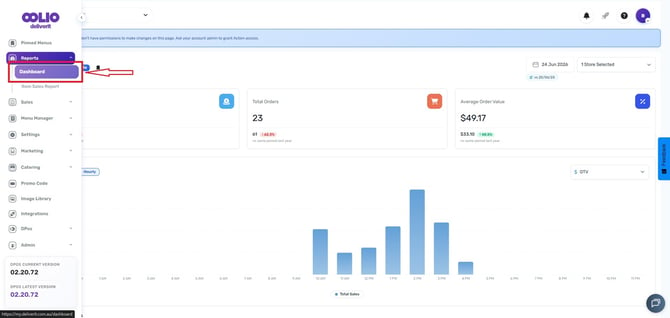
- Look at the left-hand navigation menu and click on Reports
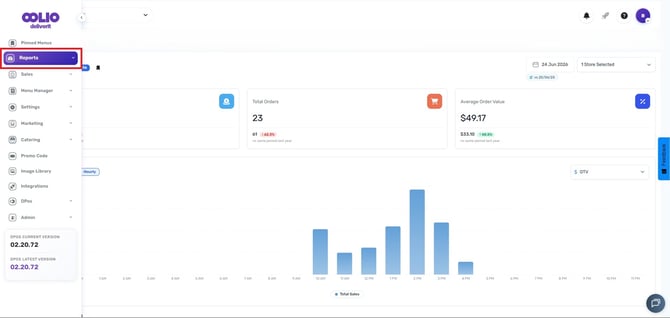
- Select Dashboard
Set Your Date Range
At the top of the dashboard:
- Choose the date range you want to review and click Apply.
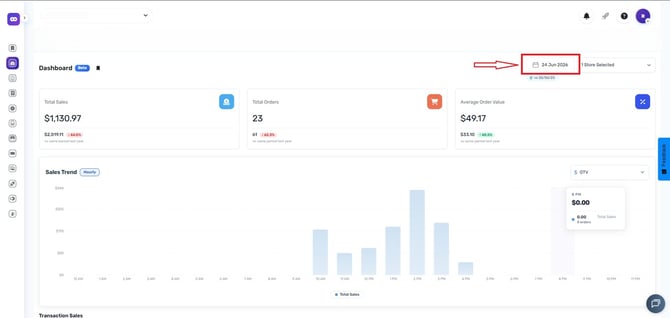
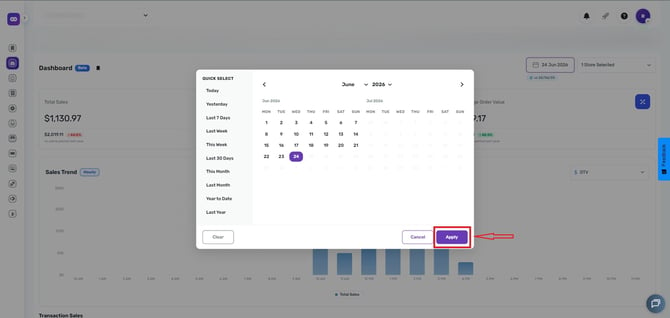
This allows you to view data for a specific time period.
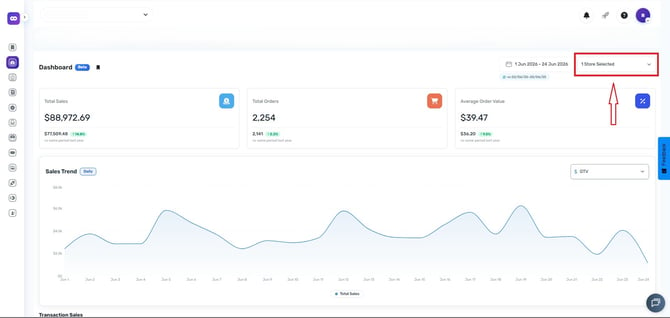
Next, choose which store’s data you want to view:
- Select one specific store, or
- Choose All Stores to view combined data
Review Key Summary Metrics
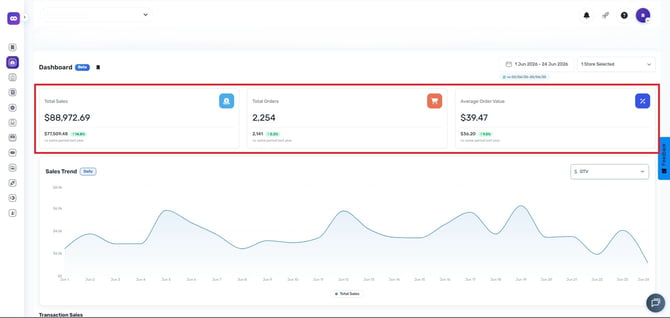
The dashboard displays important performance information, including:
- Total Sales (Value)
- Total Orders (Quantity)
- Average Order Value
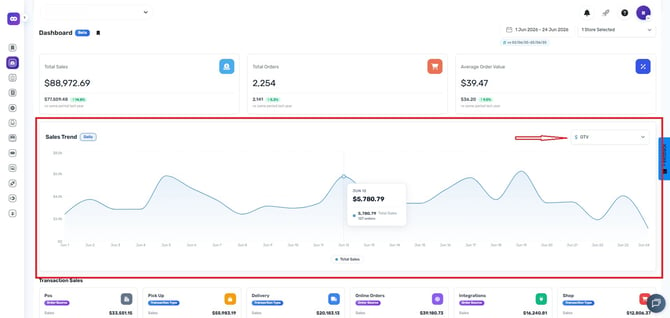
Sales Trend
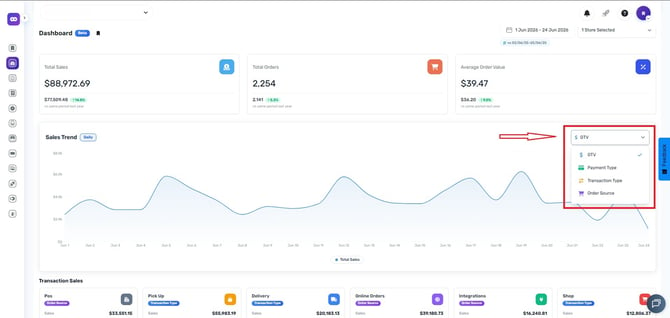
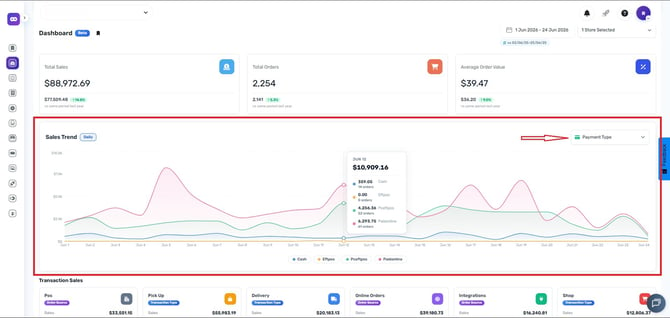
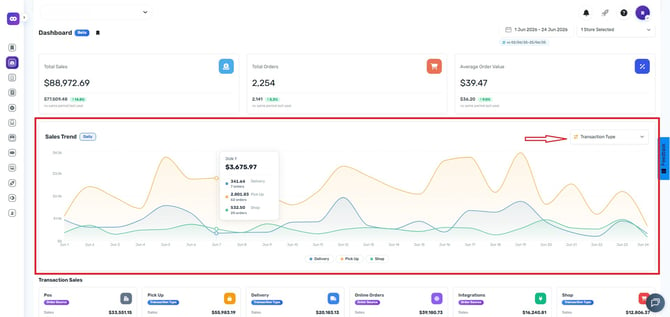
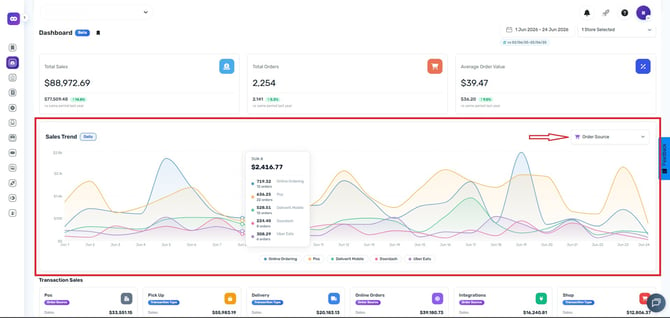
Use the dropdown to select the trend you want to analyse.
Including:
-
GTV (Gross Transaction Value)
-
Payment Types (Cash, Card, Other)
-
Transaction Type (Delivery, Pickup, Shop)
- Order Source (Online Ordering, Online App, UberEats, DoorDash)
These metrics give you a quick overview of how your business is performing.
Additional Features
-
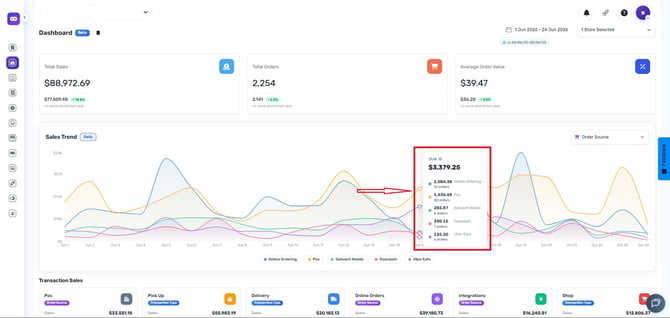
Hover over the trend to view detailed values.
-
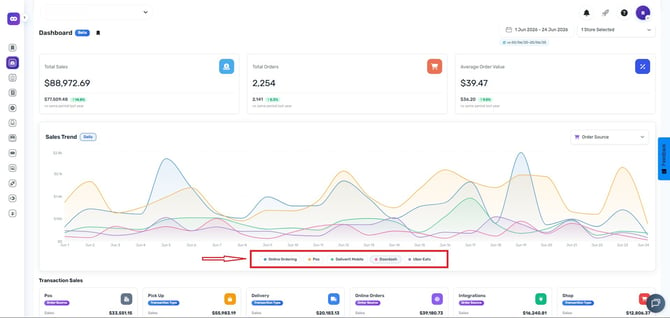
You can show or hide information by clicking or unclicking the platforms.
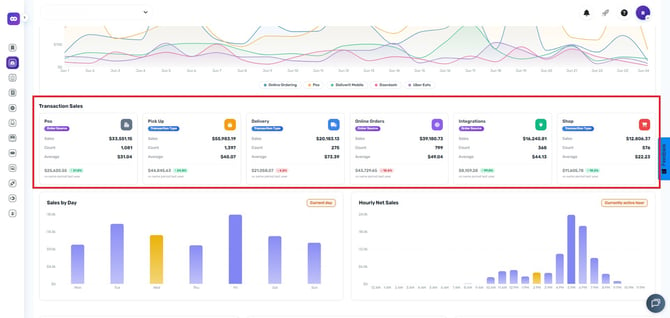
Transaction Sales
-
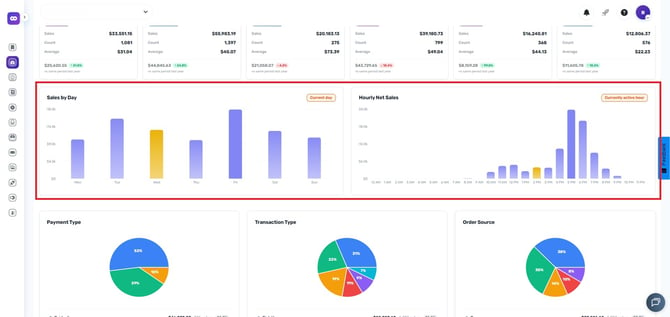
Daily and Hourly Net Sales
View Detailed Breakdowns
Scroll down to see detailed breakdowns, including:
- Payment Type (cash, card, online, etc.)
- Transaction Type (pickup, delivery, dine-in, etc.)
- Order Source (online, in-store, integrations)
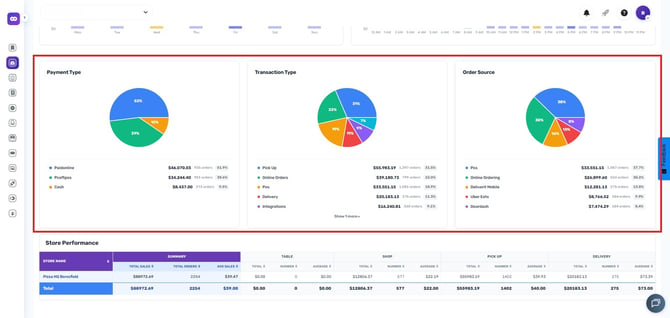
These sections help you understand where your sales are coming from.
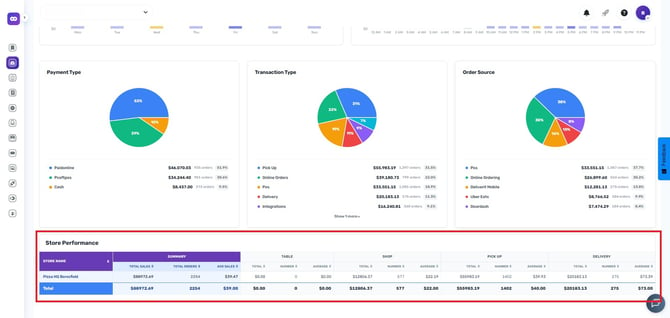
Store Performance
Export the Report
If you want to save or share the data:
- Click the Export Excel button
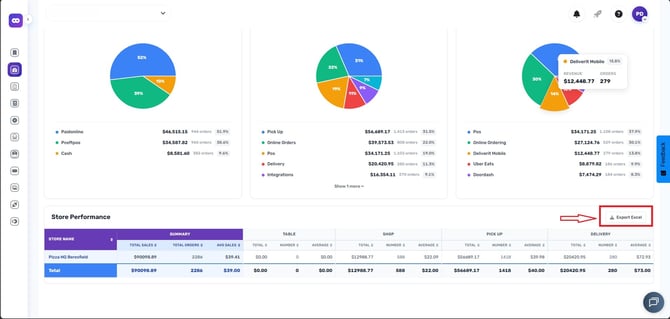
This downloads the report as a file you can open in Excel or similar programs.
Regularly reviewing your Studio Reports Dashboard helps you identify trends, track performance, and make informed business decisions. If you need further assistance, simply click the blue chat icon at the bottom-right corner of the screen to connect directly with our Application Support Team.