Step-by-Step Instructions
Log in to DPOS
Log in to your DPOS system using your staff credentials.

Access the Reports Menu
From the main DPOS screen, go to Reports.

Select the Make Screen Analysis Report
Look for a report titled “Make Screen Analysis” or similar (depending on your system version).

Set the Date Range
Choose the date range that includes the orders you want to analyze.

Run the Report
Click Preview to generate the report.

Review Key Metrics
Once the report is generated, review the following key data points:
- Orders per hour: How many orders were completed during specific time blocks?
- Time on screen: Average time orders remained on the screen before bumping.
- Quantity: Number of orders processed.
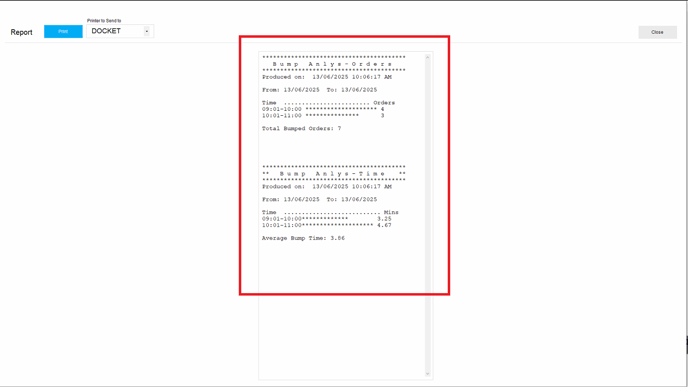
Note: If you wish to obtain a physical copy of this report, select the Print option from the top Left.
(A Save-to-File option is also available from the previous screen that can be used to store a soft copy of the report on the local computer.)
By using the Screen Analysis Report regularly, you can spot performance trends and improve your team’s speed and efficiency. If you need help interpreting the report or troubleshooting, contact our application support team.