
Step-by-Step Guide
Log in to Deliverit Studio
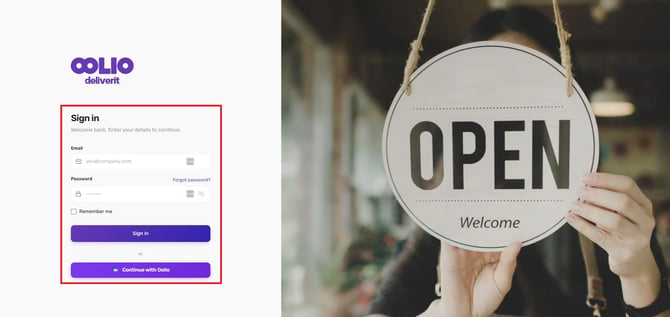
Go to my.deliverit.com.au and log in using your login credentials.
Go to Reports
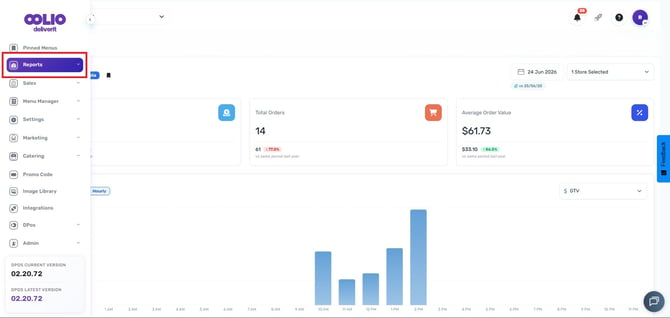
From the left-hand navigation menu, click on Reports
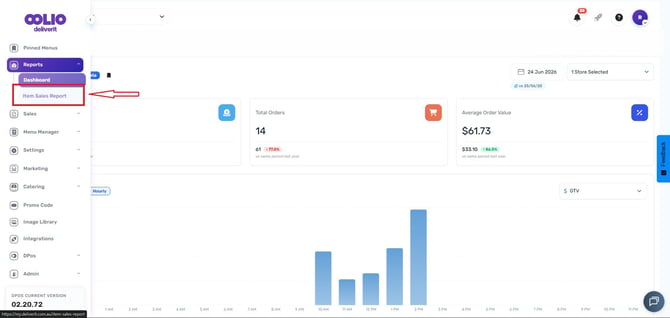
Select Item Sales Report
Set Your Filters
Before generating the report, configure the following:
- Date Range – Select the period you want to review
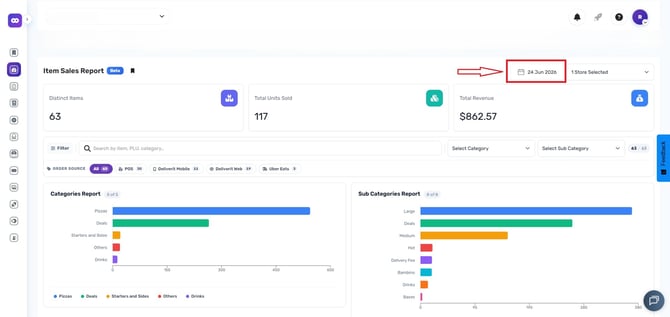
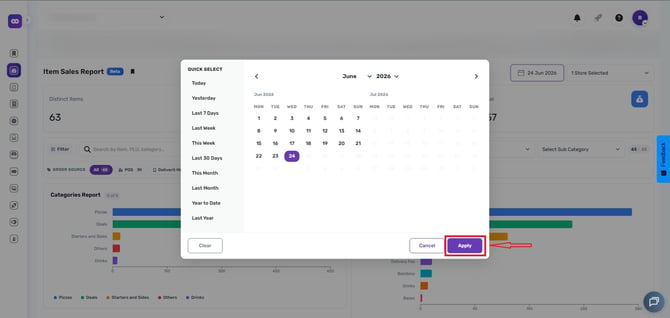
- Store – Choose a store (if you manage multiple locations)
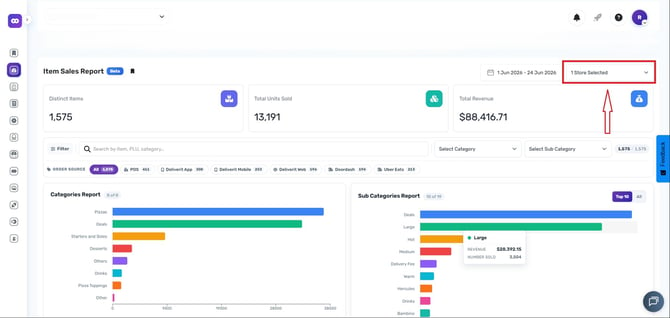
Review the Summary Data
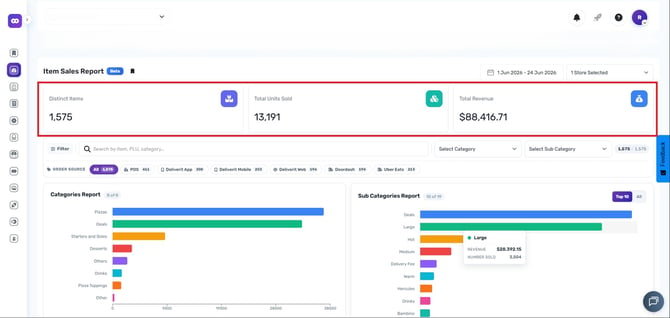
Once the report loads, you will see key metrics such as:
- Distinct Items – Number of unique items sold
- Total Units Sold – Overall quantity of items sold
- Total Revenue – Total sales generated from items
Using Filters
You can refine the report further by using the available filters:
- Search Bar – Find a specific item or product code
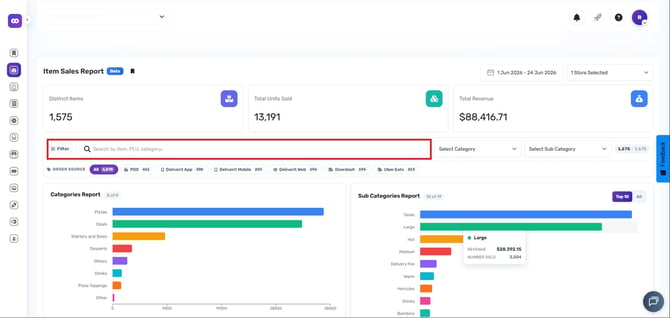
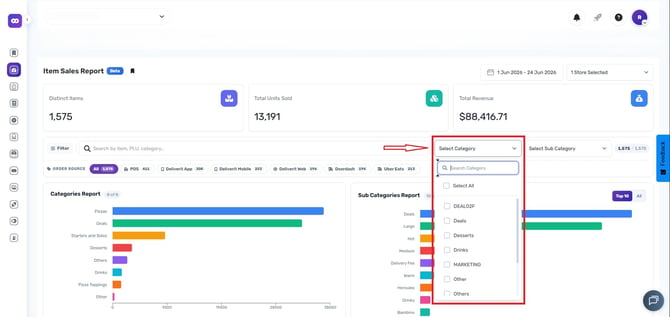
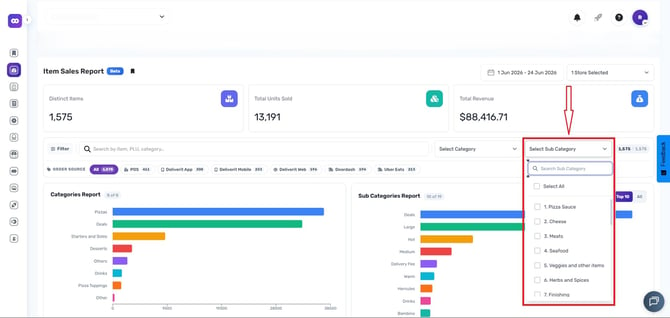
- Category & Subcategory – Filter results by product grouping
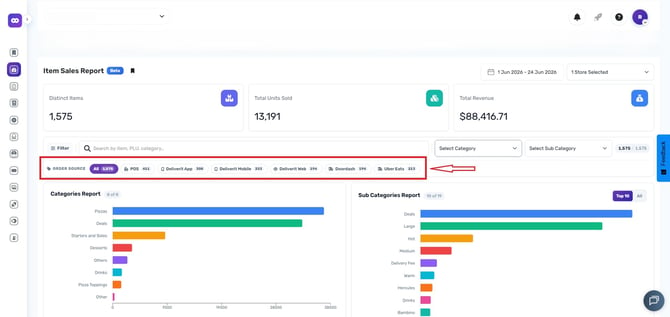
- Order Source – Filter based on where orders came from:
- POS
- Deliverit App (IOS / Android)
- Deliverit Mobile Browser
- Deliverit Web
- DoorDash
- Uber Eats
Viewing Charts and Data
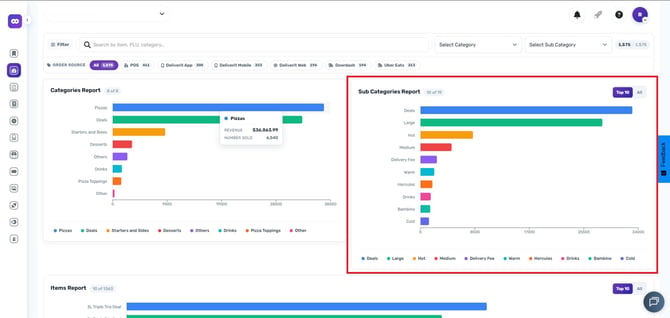
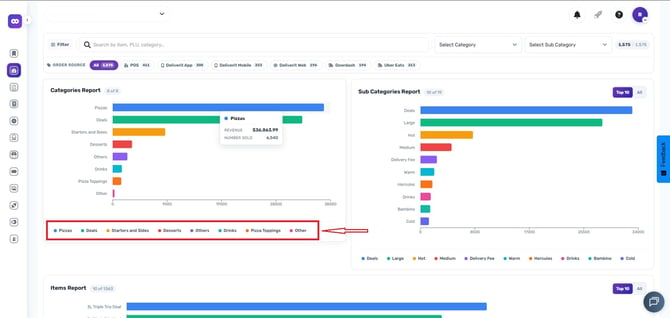
After applying your filters, the system will display visual charts for:
- Category Sales
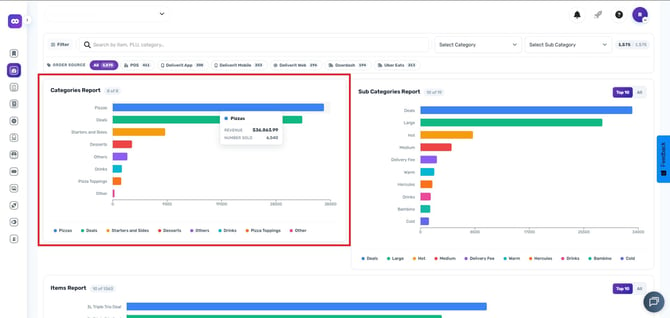
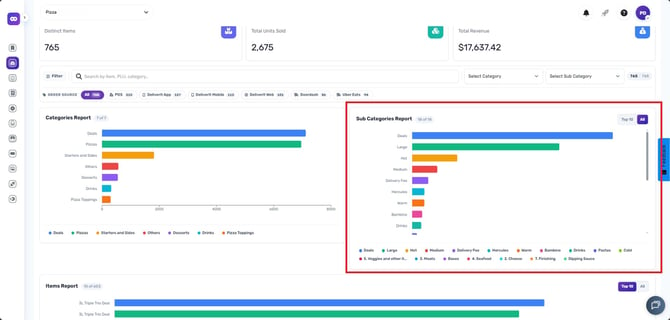
- Subcategory Sales
Display the Top 10 subcategories.
Or View all results. (use scrollbar)
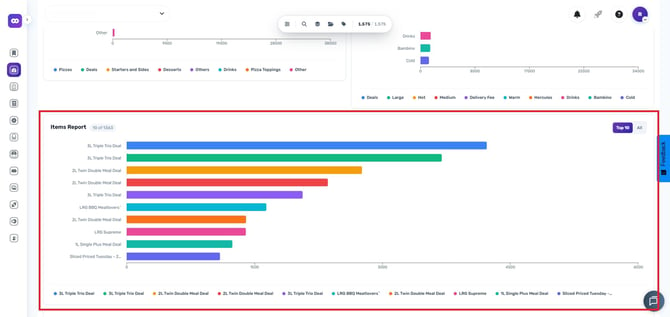
- Item Report
Display the Top 10 (default)
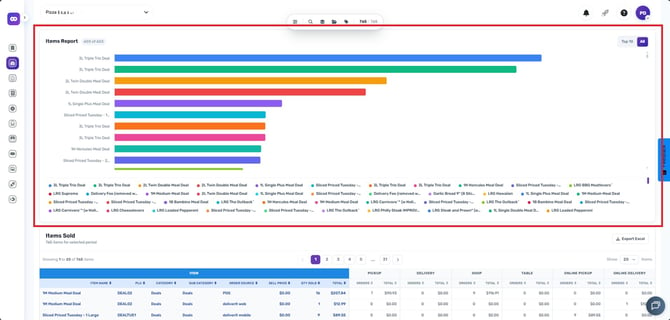
Or View all results (use scroll bar)
Tip:
You can select or deselect items in the chart to focus on specific products.
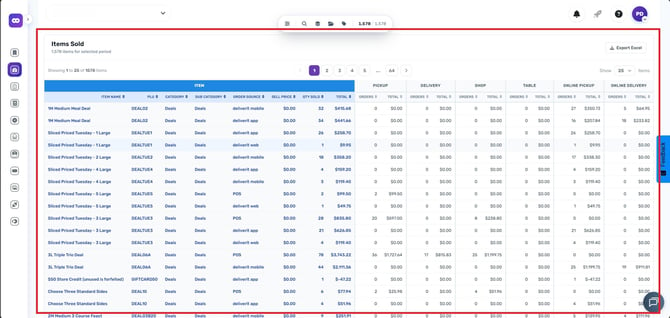
Check the Item List
Scroll down to view the Items Sold section, where you will see a detailed list of all items included in the report.
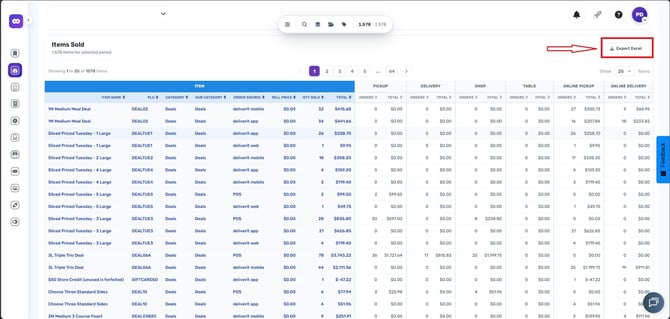
If you want a copy of the data, click the Export Excel button.
The Item Sales Report is a powerful tool for tracking product performance and identifying top-selling items. For best results, regularly review your reports and adjust filters to gain deeper insights.
If you need further assistance, simply click the blue chat icon at the bottom-right corner of the screen to connect directly with our Application Support Team.